
On the morning of 7 November 1940, engineering professor Frederick “Bert” Farquharson stood on the Tacoma Narrows Bridge with cameras. The four-month-old suspension bridge had been moving vertically in the wind, as it often did. Then its roadway began to twist: one edge rose while the other fell, and the pattern reversed again and again.
At about 11 a.m., sections began breaking away. Film of the collapse would become one of engineering’s most replayed lessons. Yet the film invites an explanation that is neat, memorable and incomplete.
The wind did not merely strike the bridge with a rhythm that happened to match its own. The more revealing question is an energy question: during each cycle, did the air remove energy from the motion or add some back?
Four months between opening and collapse
The first Tacoma Narrows Bridge opened on 1 July 1940. It was slender and visually elegant, with a main span much longer than the deck was wide. Drivers soon knew its rolling vertical motion, which produced the nickname “Galloping Gertie.” Washington State Department of Transportation records the opening and the four-month life of the span.
Engineers did not simply ignore the movement. Hydraulic buffers, devices using liquid resistance to reduce motion, and restraining cables were tried, and Farquharson studied scale models in a wind tunnel. He had observed twisting in a model and recognised its danger. On the collapse day, WSDOT’s chronology reports winds measured at about 42 miles per hour near one end, though conditions varied along the crossing. That number is historical context, not a universal bridge-failure threshold. WSDOT’s collapse account follows the interventions and the day’s observations.
The bridge was designed to carry weight and resist strong static loads, forces treated as fixed rather than changing with the bridge’s motion. But “strong enough” under a fixed load is not the same as stable when a flexible structure and moving air continuously reshape one another.
The tempting resonance story
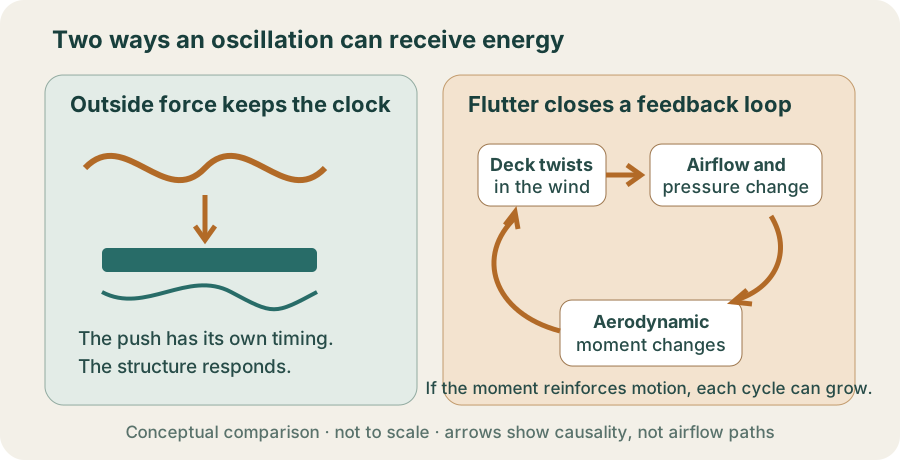
A child’s swing shows forced resonance. An outside push repeats at a frequency, a number of pushes per second, close to the swing’s natural rhythm of back-and-forth motion. If the timing is right, successive pushes add energy. The pusher’s rhythm exists independently of the swing.
That mechanism is real, and wind can form alternating vortices, swirling regions of air, behind an object. But the celebrated classroom claim that periodic vortex shedding simply matched the bridge’s natural frequency does not adequately explain the final torsional motion, the twisting of the roadway. Physicists David Billah and Robert Scanlan called that account misleading in their 1991 analysis of the collapse. The Federal Works Agency investigation also considered simple resonance improbable, as the American Physical Society’s historical review explains.
The distinction is not wordplay. In forced resonance, the forcing supplies the clock. In self-excited motion, the structure helps create the force acting on it.
When resistance becomes assistance
A moving bridge normally loses some mechanical energy each cycle through friction and internal deformation. Engineers describe this energy removal as damping. If a gust starts an oscillation and then disappears, positive damping should make the oscillation fade.
Now let the deck twist in a steady wind. Its angle and motion change how air flows around the solid side girders. The altered airflow changes the upward force (lift) and the turning force (twisting moment) on the deck. These are aerodynamic forces, produced by moving air. If the moment tends to oppose the motion, the air provides additional damping. If its timing reinforces the motion, the air behaves like negative damping: it adds more energy during a cycle than the structure loses.
Then the sequence closes into a loop:
deck twists → airflow changes → aerodynamic moment changes → the next twist grows.
This is torsional flutter. The wind supplies the energy, but the moving bridge organises how that energy enters. A perfectly steady wind can therefore sustain a growing oscillation; it need not contain a matching series of gusts.
What the model can and cannot show
EXPLORE THE IDEA
When does one cycle pay for the next?
-0.5%Net damping per radian
1.032×Amplitude after one cycle
22.1 cycles to doubleIdeal envelope
Move aerodynamic negative damping below structural damping: the next-cycle bar shrinks. Make the values equal: the simple envelope is neutral. Raise the aerodynamic value above the structural one: the bar grows even though no repeating gust has been entered.
Scroll the diagram sideways to see every label.
Illustrative linear envelope: amplitude multiplier per cycle = exp[−2π(structural damping − aerodynamic negative damping)]. Percentages are dimensionless teaching inputs, not measured Tacoma Narrows values. The model omits wind speed, mode shape, stiffness, mass, nonlinear saturation, stresses and failure. It is not a bridge-design or safety calculator. No animation.
Why the shape mattered
The 1940 deck used relatively shallow, solid plate girders, large supporting beams made from steel plates, along its sides. That helped create a narrow, streamlined-looking roadway, but the solid surfaces also interacted strongly with crosswind. The bridge had low resistance to torsional deformation, so aerodynamic moments could produce substantial twisting.
The official investigation led by Othmar Ammann, Theodore von Kármán and Glenn Woodruff concluded that excessive flexibility and the solid girder-and-deck form were central to the instability. Their original report was published in March 1941 and is preserved by Caltech’s archive. Precise descriptions of every stage are still discussed, but the principal engineering explanation is self-induced torsional flutter rather than a single externally imposed beat. WSDOT’s technical history separates vortex shedding, torsional motion and flutter.
Film can obscure as well as reveal. Copies have sometimes been played at the wrong rate, altering how violent or slow the motion appears. More importantly, a film shows displacement, not the pressure field and phase relationships that transfer energy. The camera preserves what the bridge did; the explanation requires measurements, models and equations that ask why the motion grew.
Failure changed the design question
The lesson was not “never build a flexible bridge.” Flexibility helps long spans survive loads and movement. Nor was it simply “make every bridge heavier.” Mass, stiffness, damping and aerodynamic shape work together.
After Tacoma, wind-tunnel testing of long-span bridge sections became normal practice. Designers could change deck profiles, add openings or use trusses so air passed through, stiffen the structure, and test whether oscillations decayed across expected wind conditions. The replacement Tacoma Narrows Bridge, opened in 1950, used deep open trusses, frameworks of connected beams with gaps for air to pass through, and underwent model testing. WSDOT notes that aerodynamic stability analysis now supplements ordinary structural analysis for long spans.
That shift is the enduring discovery. A bridge is not a passive object receiving wind load; it can be one participant in a coupled system. Air moves the structure, the structure redirects the air, and the next force remembers the last motion.
The old film becomes more interesting once the easy explanation is removed. We are not watching a bridge encounter one unfortunate rhythm. We are watching a feedback loop draw energy from the wind into each growing twist, until the bridge can no longer withstand the motion.
YOUR PERSPECTIVE
Join the discussion
What surprised you? Have a question or a correction? Share your thinking.
No comments yet. Start the conversation.
Sign in with ChatGPT to commentAnyone can read the discussion. Sign-in helps limit spam.