
On 1 January 1995, a wave more than 25 metres high was recorded at the Draupner platform in the North Sea. The enduring importance of that event is easy to miss when attention goes straight to its height. It left a measurement that researchers could revisit, compare with theories and argue about.
Years later, Oxford engineers Thomas Adcock and Paul Taylor were still examining its peculiar shape. Their analysis suggested that two wave groups crossing at roughly right angles could help explain the record. Oxford’s account of their 2011 research presents that as an interpretation supported by clues, rather than a photograph of everything the surrounding ocean was doing.
That distinction is central to rogue-wave science. An exceptional wave can be well documented while its precise formation remains open to investigation. The question is not whether the sea can produce surprises. It is how ordinary wave motion becomes an extraordinary local event.
Large compared with what?
A rogue wave is not simply any wave tall enough to frighten a sailor. Oceanographers commonly compare an individual wave’s height with the significant wave height of the surrounding sea. In its traditional form, significant wave height is the average height of the highest third of waves in a record.
The NOAA Ocean Prediction Center explains the comparison: waves exceeding roughly twice that significant height are classed as extreme or rogue. This makes the label relative. In a sea with a significant height of four metres, the commonly used boundary is about eight metres; in a much rougher sea, it is higher.
These are illustrative numbers, not a forecast. Nor is significant wave height a ceiling. A forecast describing a four-metre sea does not promise that every passing wave will stay below four metres. It summarises a variable surface using one useful statistic.
Wave height also differs from crest elevation. A crest is the top of a wave; a trough is its low point. Wave height is the vertical distance between them. Crest elevation measures only how far the top rises above a reference water level. Mixing those quantities can make the same event appear to have conflicting measurements.
The sea adds motions together
Wind supplies energy to many familiar surface waves. But a patch of ocean usually contains more than a tidy procession of identical crests: local waves and swells from elsewhere can overlap. A travelling pattern is not the same as a slab of water marching across an ocean. Water particles move as the disturbance passes. NOAA’s introduction to ocean waves includes a short explanatory video about that transfer of energy.
For waves that are sufficiently gentle, a useful first approximation is superposition: add the surface displacements contributed by each component at the same place and time. If several crests coincide, the resulting elevation increases. If one contribution is a trough, it offsets some of the others.
NOAA identifies this constructive interference as one route to unusually large waves. The large feature can be brief because the component patterns continue moving. Alignment is an event, not a permanent new supply of energy.
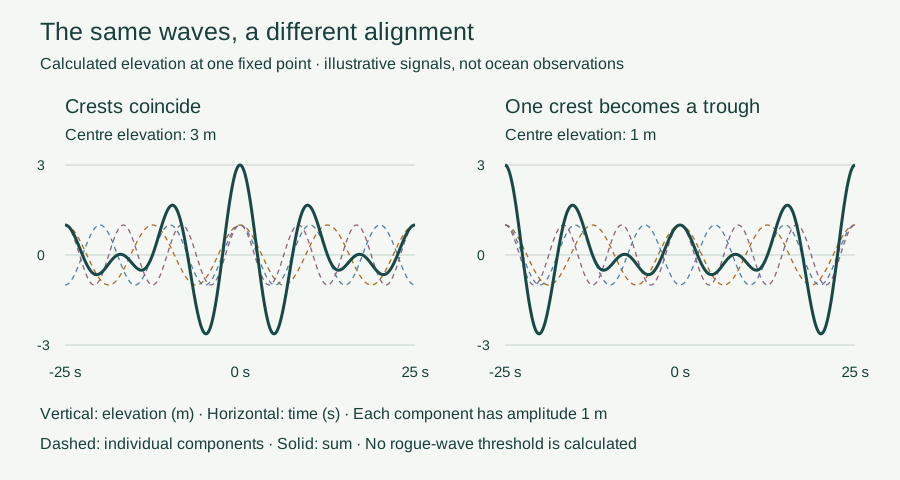
Imagine three components each contributing one metre above the reference level at a chosen instant. Their sum is three metres. Reverse one contribution so that it is one metre below the reference level, and the sum becomes one metre. Nothing mysterious was added or removed: we changed whether the high or low parts of the waves met at that instant.
What the interactive model actually calculates
Where the simple picture stops
Adding gentle waves is a starting point, not a complete description of steep water surfaces. In steep waves, the motions affect each other more strongly. The resulting surface is no longer described by simply adding independent waves. Scientists call these nonlinear effects. Currents can also concentrate wave energy; NOAA discusses opposing-current environments such as the Gulf Stream and Agulhas Current. A large wave therefore need not have one universal origin.
The challenge is deciding which effects matter in a particular record. In a 2011 study of extreme-wave statistics, Johannes Gemmrich and Chris Garrett examined why some North Sea observations contained more extremes than a standard model predicted. Several candidate corrections changed the probabilities without explaining the whole pattern; their simulations indicated that higher-order corrections could help for steep waves.
This is a useful lesson in scientific modelling. A model may capture average conditions well and still perform poorly in the far tail, among the rarest, largest events. Agreement in the middle does not automatically establish accuracy at the edge. Conversely, finding one extreme observation does not tell us which missing physical process is responsible.
Evidence grows one record at a time
Later work widened the evidence base. A 2021 study by Dion Häfner, Johannes Gemmrich and Markus Jochum analysed roughly 1.5 billion individual waves from a filtered buoy dataset. In the conditions studied, the relationship between crests and troughs was a stronger indicator of rogue-wave occurrence than several traditionally favoured parameters.
Their results supported an important role for linear superposition in many observed events, with nonlinear contributions providing corrections. That is a finding about the examined data and conditions, not proof that every dangerous wave shares one recipe. Estimating how likely extreme waves are in a given sea is different from predicting where and when the next one will appear.
Rogue waves should not be confused with tsunamis, whose generation and very long wavelengths create a different physical problem. Nor does a dramatic image alone supply the surrounding measurements needed for the statistical label.
Draupner’s lasting gift was not a universal answer. It was a record strong enough to make explanations testable. The ocean’s apparent disorder contains measurable structure, but learning its rules also means recognising how much one astonishing crest cannot tell us.
EXPLORE THE IDEA
What changes when crests line up?
At 0°, all three crests align at the centre. At 180°, the middle component contributes a trough, reducing that elevation from 3 m to 1 m. This is elevation above the reference level, not trough-to-crest wave height.
Scroll the diagram sideways to see every label.
Three synthetic one-metre-amplitude cosine components; periods 12.5, 10 and 8.33 seconds. Horizontal axis: time at a fixed point. Thin dashed curves are components; the thick curve is their sum. Phase moves the middle component within its cycle. Linear illustration only: no significant-wave-height estimate, rogue classification, currents, breaking or forecast. No animation.
YOUR PERSPECTIVE
Join the discussion
What surprised you? Have a question or a correction? Share your thinking.
No comments yet. Start the conversation.
Sign in with ChatGPT to commentAnyone can read the discussion. Sign-in helps limit spam.