
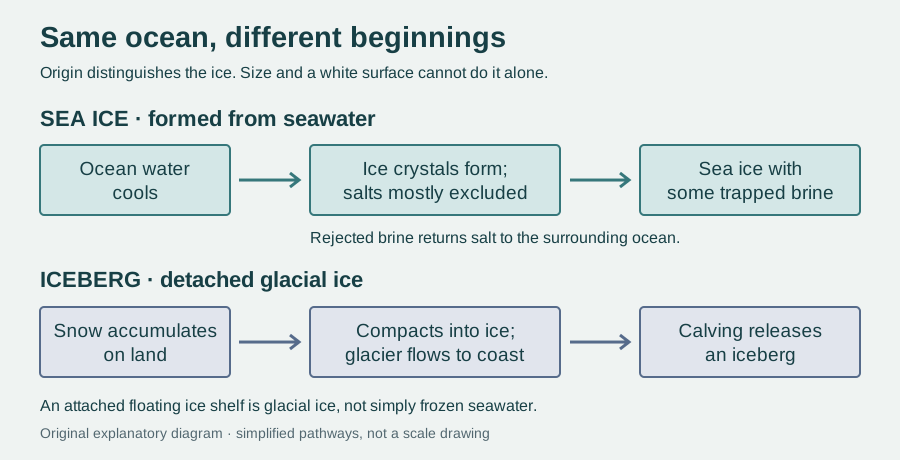
The ice that struck Titanic in April 1912 had a history before it entered the Atlantic. It was an iceberg: a detached piece of glacial ice, formed through the accumulation and compression of snow. It was not a patch of ocean that had simply frozen where the ship encountered it.
That distinction can disappear in a photograph. An iceberg and a broken slab of sea ice both look white, both drift, and both have much of their substance underwater. Yet the question “Where did this ice begin?” separates two very different physical stories.
Titanic’s sinking helped drive international action on iceberg hazards. The first Safety of Life at Sea convention in 1914 established an international framework for ice patrol services, following earlier patrol efforts. The US Coast Guard’s historical account explains the connection. The lesson was practical: knowing an object is ice is not enough to understand where it came from or where it may travel.
One begins in the sea; one begins with snow
Sea ice forms when ocean water freezes. Glacial ice starts with snowfall that survives, accumulates and becomes compressed into ice on land. Glaciers flow under their own weight. Where a glacier reaches the coast, pieces can break away in a process called calving, becoming icebergs.
A glacier may also spread into a floating extension that remains attached to the land ice: an ice shelf. An iceberg can calve from that shelf. Although both an ice shelf and sea ice float, a shelf is supplied by glacial ice rather than being simply frozen seawater. Woods Hole Oceanographic Institution explains these different origins.
Size is therefore an unreliable test. A huge sheet is not automatically an ice shelf, and a small floating fragment need not be sea ice. How the ice formed tells us more than its size or shape.
Freezing seawater does not freeze all its salt
Fresh water freezes near 0°C at ordinary surface pressure. Typical seawater, with about 35 grams of salts per kilogram of solution, starts freezing around −1.8°C. Salt lowers the freezing temperature; the exact value depends on salinity and pressure. The Met Office’s overview describes the process.
As seawater freezes, water molecules join an ice crystal structure that largely excludes dissolved salts. Those salts concentrate in the liquid left between the crystals. Newly formed sea ice is consequently a mixture of comparatively fresh ice and pockets or channels of very salty liquid called brine.
Much of the brine escapes into the ocean. Some remains trapped, so “sea ice contains no salt” is misleading. Drainage and summer flushing tend to make surviving ice fresher over time. NSIDC explains the brine pathways. An iceberg, by contrast, largely inherits the freshwater origin of its parent glacier, although seawater can interact with its surface. The distinction concerns where most of the ice came from and what it contains. It does not mean that seawater cannot enter or affect either kind of ice.
A moving cover, rather than a frozen continent
Sea ice does not have to begin as a smooth white plate. Small crystals can collect into slush; in choppy water, collisions build rounded pancake ice with raised rims. Pieces may join into larger floating sheets, called floes. Winds and currents push them apart or press them together into ridges. The piled-up ice can extend far below the water, forming a keel. These are products of freezing and deformation, rather than miniature glaciers.
Some sea ice melts during its first summer. Ice that survives can thicken during later winters, although ridges and snow complicate any simple relationship between age and thickness. NSIDC distinguishes first-year and multiyear ice by whether it has survived a summer melt season. A flat surface alone does not reveal the history hidden underneath.
The visible height is only part of the measurement
Floating ice displaces water whose weight balances its own weight. Ice is less dense than seawater, so part remains above the surface. That exposed height is called freeboard; the submerged depth is the draft.
Snow changes the balance. Add snow to a floating slab and its extra weight pushes the ice downward. The top of the snow can rise even while the actual ice surface moves closer to the waterline. A height measurement must therefore identify which surface it measures.
ESA’s CryoSat radar and NASA’s ICESat-2 laser offer different views of snow-covered ice. Radar can penetrate snow and return from close to the ice surface, whereas the laser generally measures the snow top. ESA describes why combining the measurements helps. Neither reading is automatically the full ice thickness. A peer-reviewed comparison of thickness-retrieval methods shows that assumed ice density, as well as snow depth, matters.
The model below lets you change slab thickness and snow depth separately. Its chosen densities and level geometry are teaching assumptions, not observations or a navigation assessment.
The small calculation beneath the floating slab
Why the difference matters beyond a ship’s route
Sea ice forms a broad seasonal cover that reflects sunlight and changes exchanges of heat between ocean and atmosphere. Losing that cover exposes darker water that absorbs more sunlight, reinforcing warming. NOAA’s short film and transcript explain the feedback without requiring the interactive model.
To understand sea-level rise, ask another question: was the ice already floating, or was it supported by land? Floating ice has already displaced water, so its melting is not the main direct mechanism of sea-level rise. Adding formerly land-supported ice to the ocean is different. A floating ice shelf can slow the glacier feeding it, rather like a support holding back part of the flow. Losing that support can let more land ice enter the sea. NSIDC explains that indirect effect.
Two white objects can therefore record opposite journeys: ocean water becoming ice, and land ice entering the ocean. Reading that history turns a frozen surface into evidence about salt, buoyancy, moving glaciers and the changing planet.
EXPLORE THE IDEA
Can more snow hide the ice’s thickness?
Keep ice thickness fixed, then add snow. Compare the height of the ice surface with the height of the snow top: they move in opposite directions.
15.2 cmIce surface above water
35.2 cmSnow top above water
1.85 mSubmerged draft
At 2 m ice thickness, adding 0.20 m of snow lowers the ice surface from 21.1 cm to 15.2 cm above water. The snow top is then 35.2 cm above water. A taller visible top need not mean thicker ice.
Scroll the diagram sideways to see every label.
Level slab floating freely in hydrostatic balance. Fixed illustrative densities: ice 917 kg/m³, dry snow 300 kg/m³, seawater 1,025 kg/m³. Controls are teaching inputs, not field measurements. Vertical scale stays at 40 drawing units per metre; horizontal width is arbitrary. No ridges, waves, brine variation, flooding, grounded ice or satellite-signal penetration are modelled. Not an ice-safety or navigation assessment. No animation.
YOUR PERSPECTIVE
Join the discussion
What surprised you? Have a question or a correction? Share your thinking.
No comments yet. Start the conversation.
Sign in with ChatGPT to commentAnyone can read the discussion. Sign-in helps limit spam.